-

 Create a project on CADLAB.io
 -
 Upload PCB design files
 -
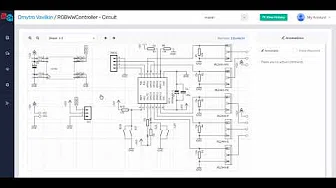 View schematics and board layouts
 -
 Visual schematic and layout diff
 -
 Design annotations
 -
 Organizations and project members
 -
 GitHub integration
 -
 GitHub Chrome extension